Unemployment Insurance Claims Data
Labor Market Information Resources and Data: Home | By Customer | By Subject | By Geography | Data Search Tools | Online Services
The Unemployment Insurance (UI) monthly claims data are used in current economic analysis of unemployment trends in the Nation and in each State.
Initial claims measure emerging unemployment and weeks paid measure the duration and severity of unemployment.
The Data:
- UI Claims Data are available from the US Department of Labor Web site. Weekly data are available from 1987 to present (not seasonally adjusted) and monthly from 1971 to present (not seasonally adjusted). Data do not include special UI programs.
- Unemployment Rates and Labor Force for California and Los Angeles are available from 1976 to present (seasonally adjusted and not seasonally adjusted) and all other areas from 1990 to present (not seasonally adjusted).
- Click here to download seasonally adjusted data for California UI claims, 1978 to present.
Data and charts last updated: April 25, 2024
March 2024
In March 2024, 269,584 initial unemployment insurance claims were filed and 1,591,671 total weeks were paid in California. Adjusting for seasonality 283,743 initial claims were filed and 1,558,933 weeks paid.
Month over Changes
Initial claims increased 92,208 (48.1 percent) and weeks paid were up 38,254 (2.5 percent) from February, both seasonally adjusted.
Year over Changes
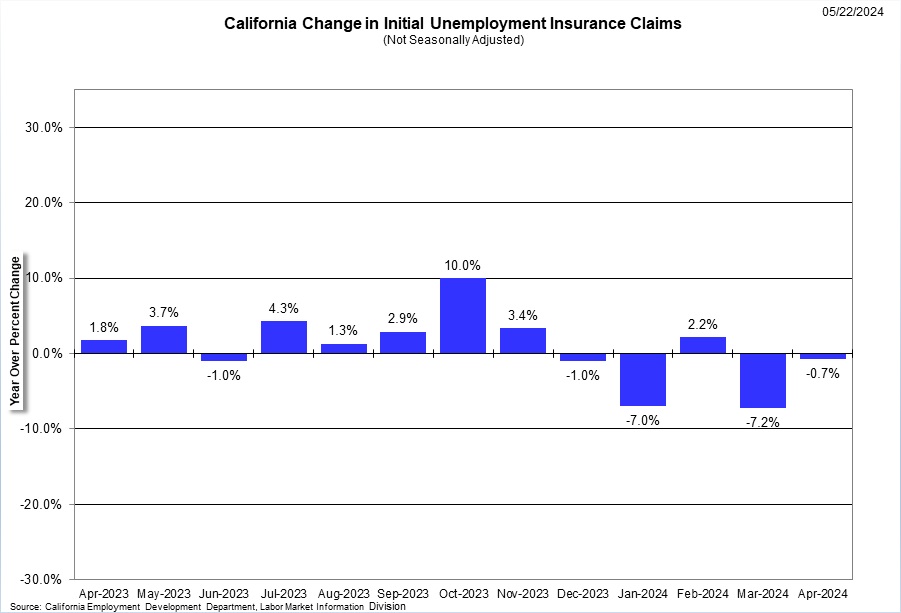
Initial claims increased 68,988 (34.4 percent) and weeks paid were up by 74,376 (4.9 percent) from March 2023. Note: Year over changes are measured using not seasonally adjusted data since comparing the same month the previous year is not subject to seasonal patterns.
Analysis
Seasonally adjusted, initial claims were up over the month 92,208 (48.1 percent), while over the year the initial claims were up 68,988 (34.4 percent). The March 2024 year over increase was the 23rd increase since the new period in unemployment claims began in March 2020. Weeks paid increased by 38,254 (2.5 percent) over the month and increased by 74,376 (4.9 percent) since March 2023. March 2024 was the 28th year-over increase in weeks paid since the new unemployment claims period began in March 2020. March 2024 marks forty-ninth month where claims related to COVID-19 have been represented.
The following charts are updated monthly using the most recent data available from the above sources.
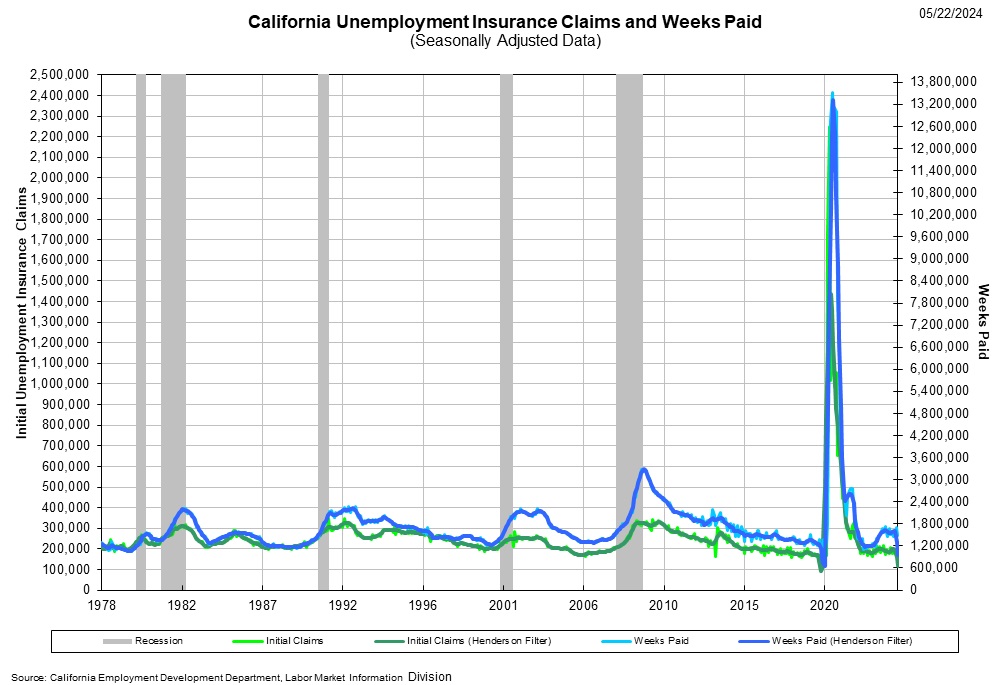
This chart illustrates a comparison of initial unemployment insurance claims and number of weeks paid from January 1978. For the purpose of this chart, data have been seasonally adjusted by the Labor Market Information Division (using the x12 software provided by the Census Bureau) and a Henderson-13 trend filter is used to smooth data.
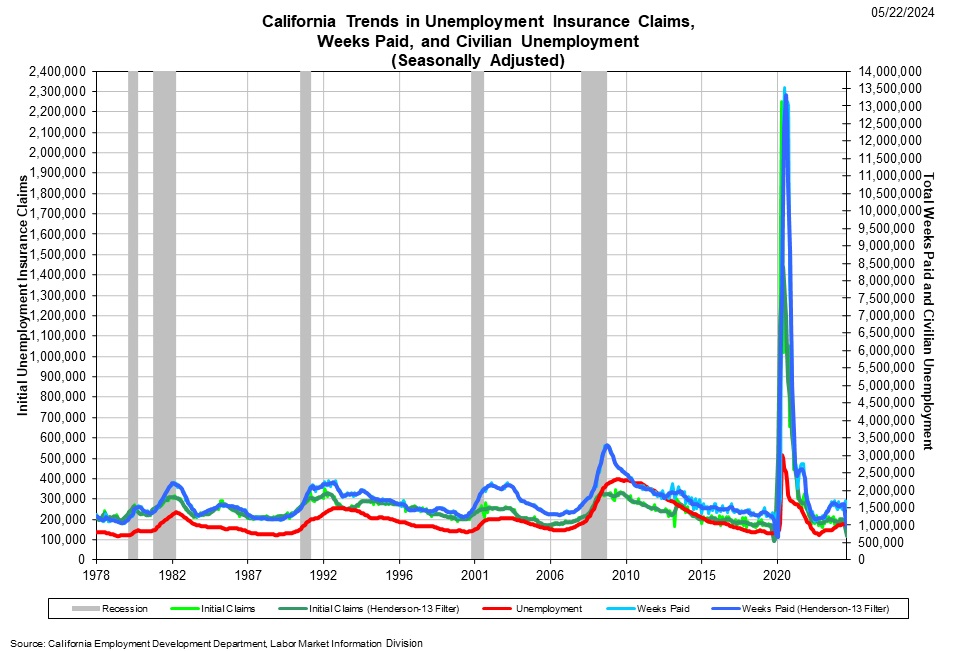
This chart illustrates a comparison of initial unemployment insurance claims, number of weeks paid, and the number of unemployed persons. For the purpose of this chart, both initial unemployment insurance claims and weeks paid have been seasonally adjusted by the Labor Market Information Division (using the x12 software provided by the Census Bureau) and a Henderson-13 trend filter has been used to smooth data. Unemployed persons is measured monthly and seasonally adjusted by the Bureau of Labor Statistics as part of the Local Area Unemployment Statistics program.
Contact Information:
For questions regarding not seasonally adjusted unemployment insurance claims, contact the Unemployment Insurance Policy and Coordination Division,
(916) 654-7401.
For all other questions, including seasonal adjustment of data, contact the Employment Development Department, Labor Market Information Division,
(916) 262-2162.
Note: Seasonal factors have been updated for the entire series beginning with the January 2012 data release.